Creating the RJMetrics Mural
The Inception
Soon after RJMetrics, one of Philly's fastest-growing startups, moved into their new offices in the Widener Building, I was contacted by their Lead Graphic Designer, Zach Kozac. He said Dan Gummel, the realtor that helped find the new digs, wanted to give a house-warming present to RJM that they would never forget. He asked Zach to help him figure out something special he could do for the whole team in the office.
After considering a host of options that included hanging dodecahedrons, furniture, and various plant installations, Zach felt a mural would really have a great impact on new the space. However, instead of picking an artist and opening it up to simply fill the space with beautiful imagery, Zach had something a bit more specific in mind. He wanted this mural to speak to the culture of the company, as well as pay tribute to the elements/ideas that helped shape their product and identity.
So Zach and I sat down and the brainstorming started. His main inspiration came from the conversations and interactions he had in the office. The RJMetrics developer culture was riddled with pun-ny project names and inside jokes from among the team. One day during a great lunch conversation with co-founder Jake Stein, he and Zach were describing their love for the work of renowned cartoonist, Rube Goldberg, and the idea was born:
Create an mural that used the Rube Goldberg style to illustrate how our product manages data — from consolidation to insights.
Zach mentioned the idea to me, and we both started gathering thoughts/machine-driven inspiration. Put over-simply, RJMetrics brings various data sources together and helps businesses analyze/collaborate with it. So the idea of a working machine with a ton of moving parts (many of which were creative and humorous) seemed to align perfectly with both the function and culture that the company already stood for.
From Idea to Sketch
This was a great foundation to start from, but now it was time to get to brass tacks. If this machine has a lot of moving pieces, what are they and how do they relate to the business and culture of RJMetrics? We dove deep. Looking all the way back through the company's inception and rich history. We looked into inside jokes, marketing materials new and old, features of the product that fell by the wayside and those that were successfully launched. Then we hand-picked the ones that had the deepest roots and began to tie them together.

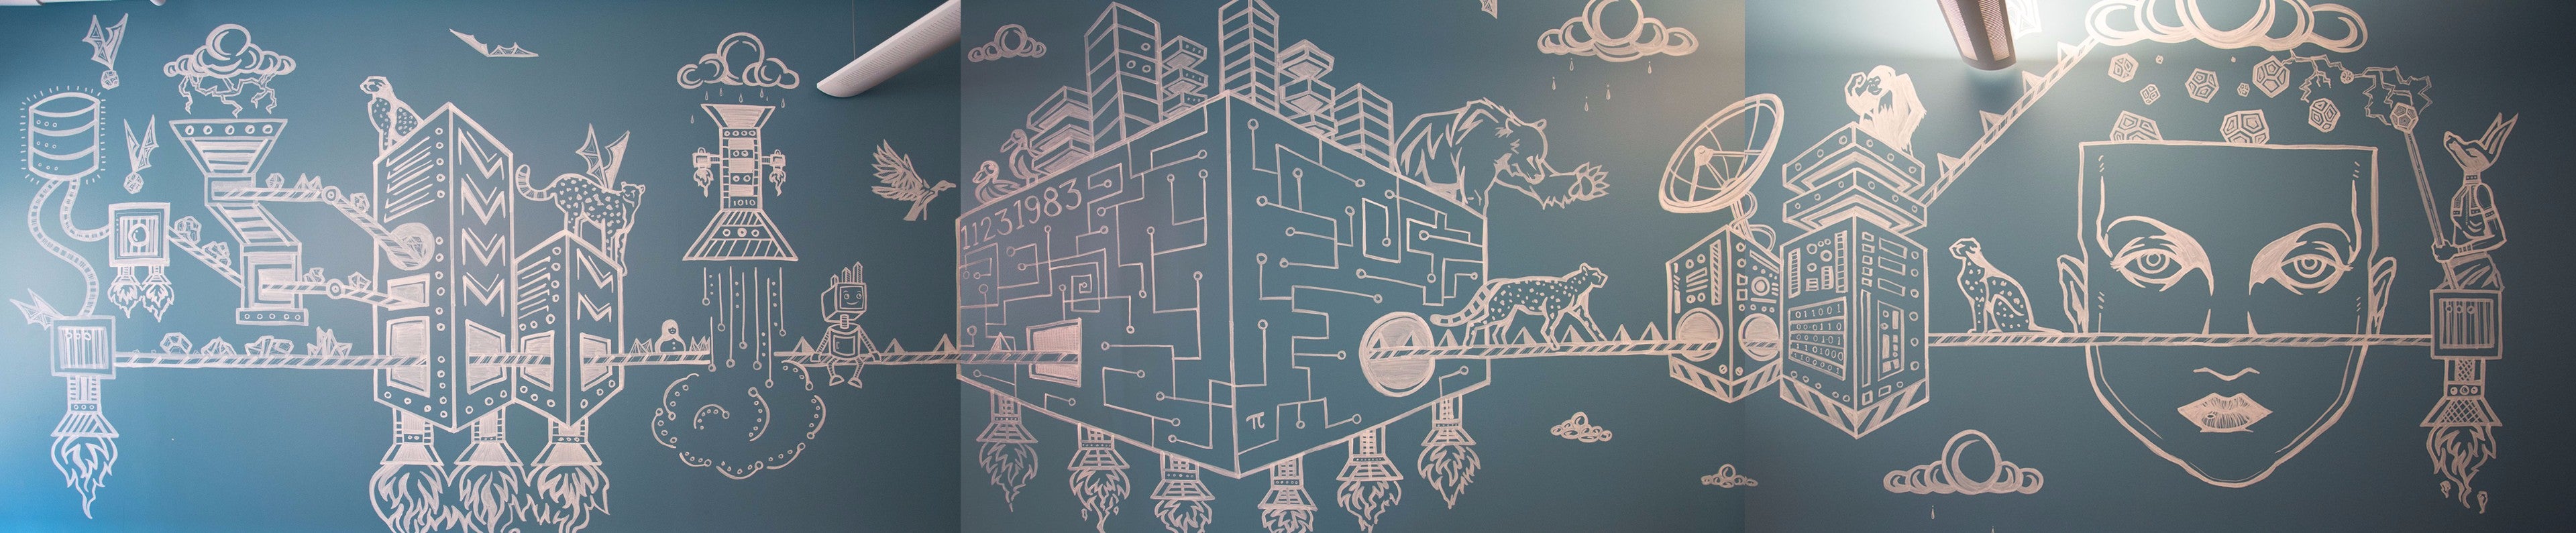
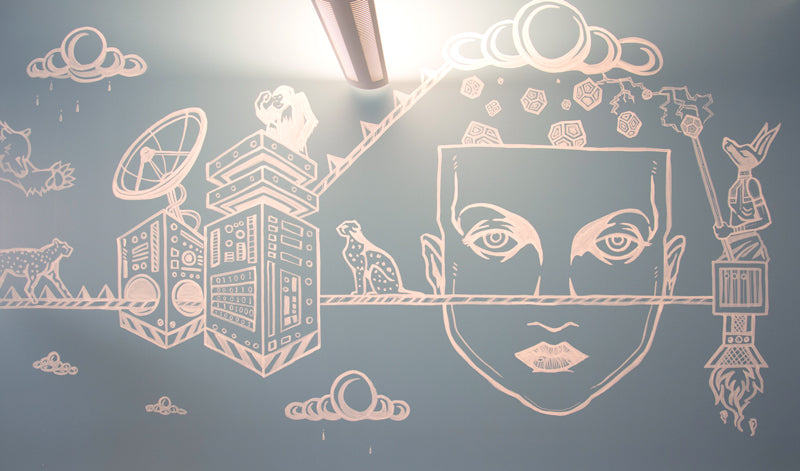
In no particular order, as if all of these things existed in their own universe, I started placing these elements along the machine. The machine itself needed to speak to what RJMetrics does on a daily basis for their many clients. I used broken and jagged shapes in the beginning of the mural to represent the raw data that the product initially brings in. As they travel through the RJM machine, they are collected, organized and transformed to the point where clients can use then make better decisions. In the end the "data shapes" are sent back up to the cloud and projected back out to their clients. Notice that the shapes in their final state are dodecahedrons — representing the newly found business insights, and the brand of RJMetrics.
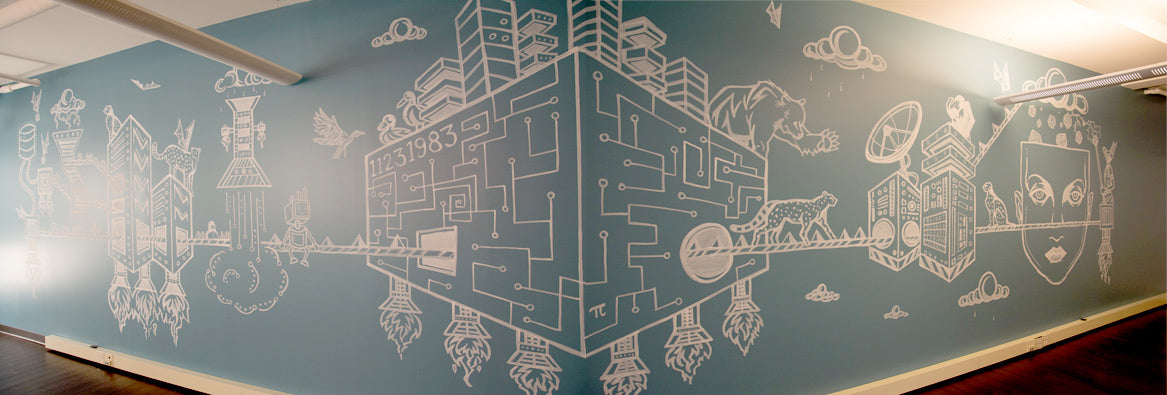
The Machine: Sections 1 – 3
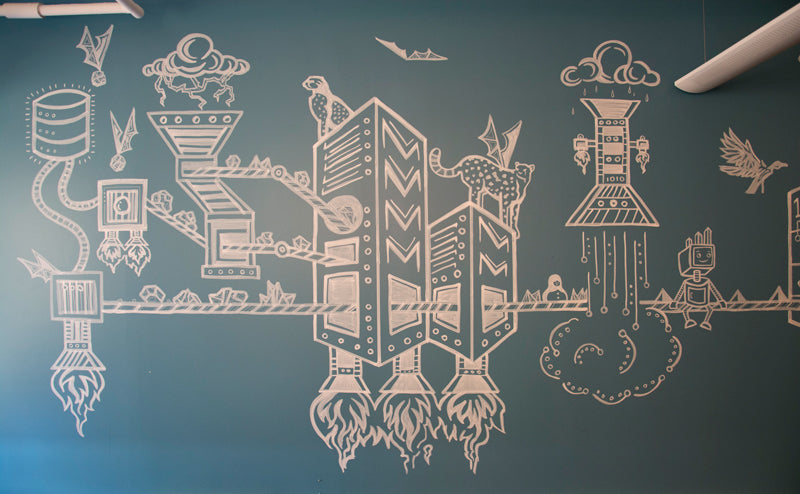
Section 1 - Data Importing
The first step was to show how RJMetrics pulls data from Cloud Based Storage sources, Databases, the Import API, and File Uploads (spreadsheets and CSVs). This is one of the most important functions of the software and prepends the data organization, optimization and analysis.
Section 2 - Extraction Engine
The structure where all of the conveyor belts converge represents where all of the raw data gets consolidated in one source and put in a queue for batch processing.
Section 3 - Transformation Cluster
Data transformation was an interesting challenge to represent. I sought to visualize the idea is that its a ‘horizontally-scalable data cleansing and denormalization layer.’ More or less, this is the part of the process where RJMetrics performs calculations and re-orders the data to be stored and structured properly. To show that a transformation took place, we had the newly transformed chunks look less jaggy and take on a uniform shape (pyramids).
The Machine: Section 4
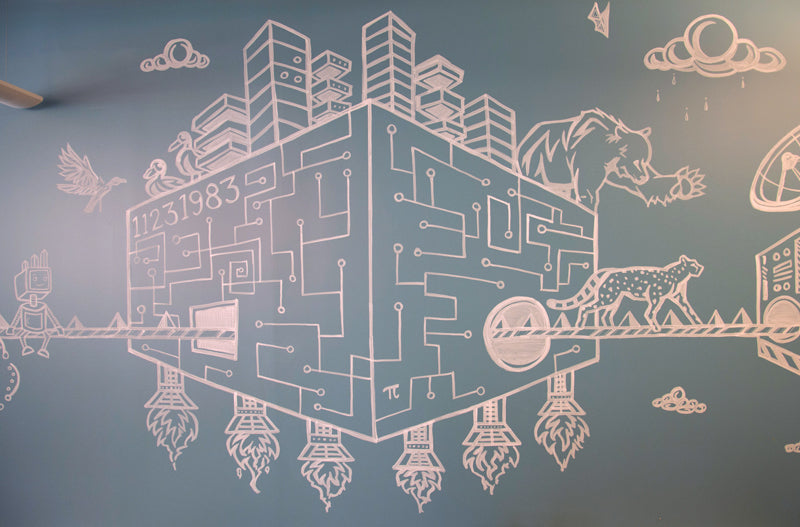
Section 4 - The Analytic Warehouse
The data warehouse was one of our most important functions as a business, and thus became a major part of the mural. It’s where data gets stored and ready for querying/analysis. We liked the idea of this being a centerpiece in our process and became a great vehicle for us to weave in a plethora of easter eggs (all of which are outlined later in this post).
The Machine: Sections 5 – 6
Section 5 - The Cache(r)
The Cache was one of the hardest concepts for us to wrap our heads around. When the end user is creating a chart and needs to use data from a certain metric, they request the data. This part of the machine takes that message, makes a query of it and spits the data back to the visualization layer. Essentially It’s the carrier pigeon between the user and the warehouse. I used a classic “switchboard” type of feel and represented it as a small hub — calling attention to the idea that it was a communicator between two major pieces of the product.
Section 6 - Visualization Layer
This is the final step, where RJMetrics actually takes the data in its polished state and brings it to it’s final state of our interface. The best description I could get from Zach was “This is where we help customers gain insights from their data around all kinds of parts of their business”. While the actual output of the product is in the form of data visualizations and analysis tools, the real challenge was to figure out how to best represent “insights.”
The Easter Eggs (from left to right)
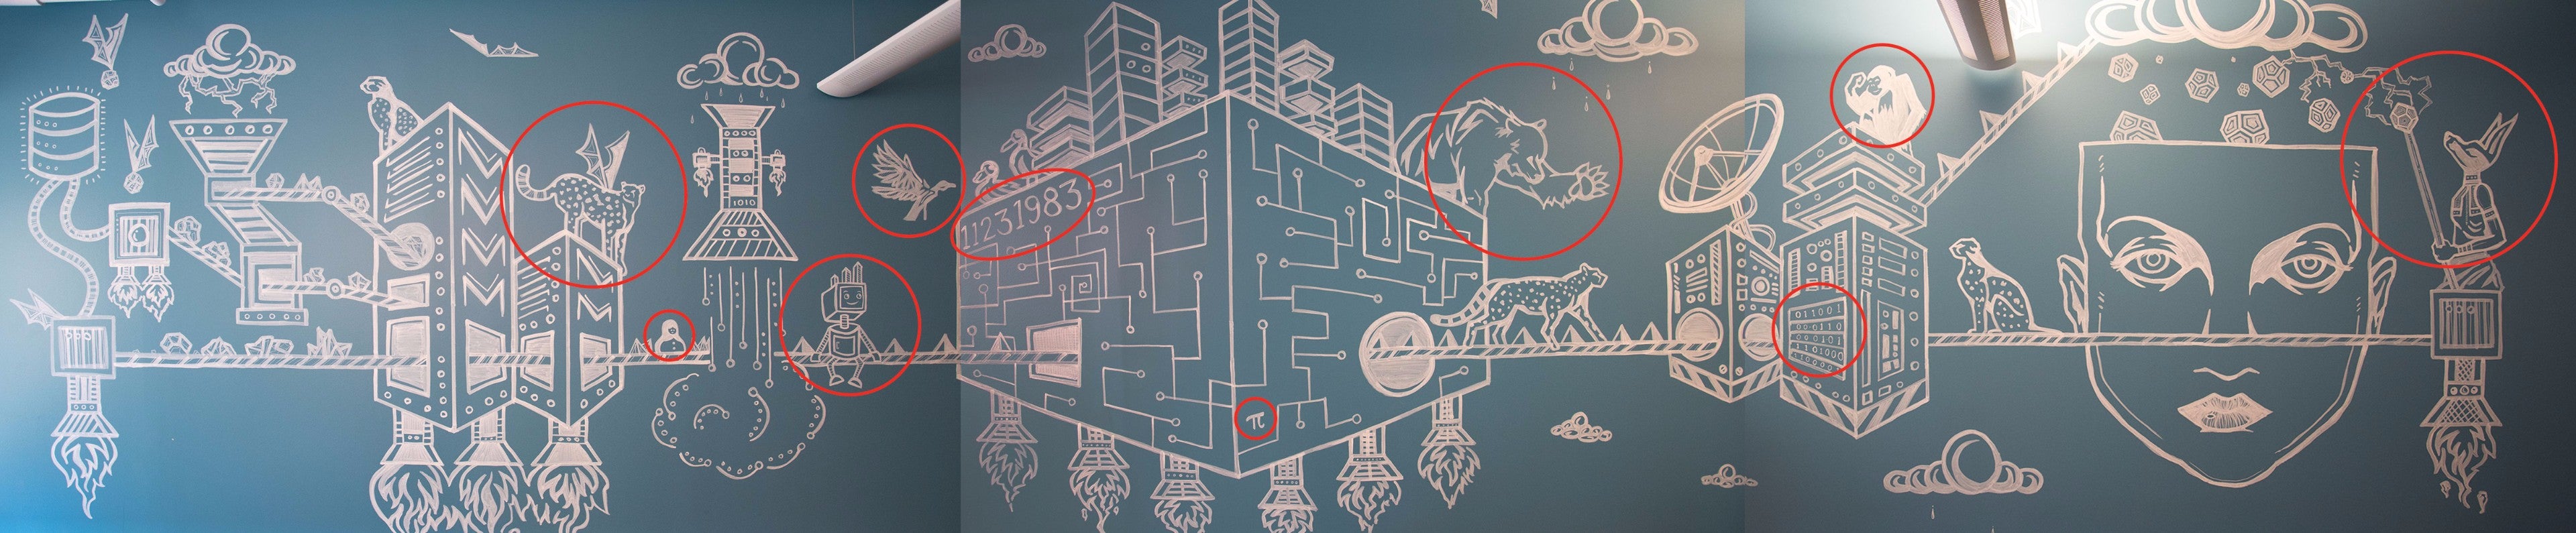
Batcheetahs
Something that you will see through out this mural are a bunch of bats flying around and cheetahs lurking about. This was a piece of the RJMetrics tech-stack that would help increase the speed of the product and was one of their longest-running office jokes. The name was created to describe the speed of our new batching system. Hence, Batch-cheetah became - Batcheetah.
Olga
One of the most successful hackathon projects in RJM history, Olga (Outbound Lead Generation Automator) is a tool that helped collect and find leads for our sales team using data we had brought in through various marketing/sales/database-scraping efforts. It’s represented as a Russian doll, the significance being how many layers of data we could collect on a single lead.

The RJM Robot Originally illustrated by a friend and fellow IH artist Parker Whitney in the very early days of RJM (before the re-brand). RJMetrics has used this robot on t-shirts, in various marketing efforts, and it remains the unofficial mascot of the company.
AqueDucks
This is a piece of software that opens up and pushes data directly to our own hosted warehouse (the city-looking thing in the middle). This software also led to the first version of RJMetrics’ newly minted product — Pipeline.
Birthday Code
In the olden days of RJMetrics, almost everyone had to get their hands dirty with some of the foundational code. During this process, co-founder Robert J. Moore needed to hard-code a date into the system (could have been any date, so long as it was in the past) and chose his own birthday. For years, this hard-coded birthday was an easter egg already existing in our back-end. It now serves as a memory of how the company started and grew.
Pi
The movie “Pi” was one of the main inspiration points for the RJMetrics re-brand (led by Zach) and we wanted to pay homage to that.
Grizzly
This piece of of our product that helped RJM improve the visibility and stability of their data connectors. Yet another part of their history that has helped pave the way for their data consolidation tool, Pipeline.
1s and 0s
While I’m happy to share many of what made the easter eggs on this project fun, this little snippet is going to have to be kept a secret (sorry folks!).
An ode to the services that RJ Metrics integrates with one of them being Mailchimp.
Anubis
This was a long-running project that was made of various components. All of which were connected to the best ways to have our clients access and query their new and improved data schema. For this reason, it was the last stop of the “data shapes” before turning into insights.
A “Living” Mural
This was a special project and I am extremely happy to be a part of it. As RJMetrics grows, they might move offices or add additional spaces to their culture. This mural was designed to be able to be reprojected onto new walls any shape and size as well as taken a part to be able to be spread out among any space. An example how something permanent can be changed, altered and adapt to the future that RJMetrics holds.


Connect